I-MR chart
I-MR-R/S Chart
 |
| I-MR chart |
Attributes control charts plot count data, such as the number of defects or defective units.
For more information about control charts, see Control Charts Overview.
Choosing a variables control chart for individuals
Minitab offers five variables control charts:
• I-MR − an Individuals chart and Moving Range chart displayed in one window
• Z-MR − a chart of standardized individual observations and moving ranges from short run processes
• Individuals − a chart of individual observations
• Moving Range − a chart of moving ranges
Individuals−Moving Range Chart
An I-MR chart is an Individuals chart and Moving Range chart in the same graph window. The Individuals chart is drawn in the upper half of the screen; the Moving Range chart in the lower half. Seeing both charts together allows you to track both the process level and process variation at the same time, as well as detect the presence of special causes.
See [29] for a discussion of how to interpret joint patterns in the two charts.
By default, I-MR Chart estimates the process variation, σ, with MRbar / d2, the average of the moving range divided by an unbiasing constant. The moving range is of length 2, since consecutive values have the greatest chance of being alike.
You can also estimate σ using the median of the moving range, change the length of the moving range, or enter a
historical value for σ.
Example of I-MR chart
As the distribution manager at a limestone quarry, you want to monitor the weight (in pounds) and variation in the 45 batches of limestone that are shipped weekly to an important client. Each batch should weigh approximately 930 pounds.
You previously created a Moving Average chart. Now you want to examine the same data using an individuals and moving range chart.
How to make the I-MR Chart
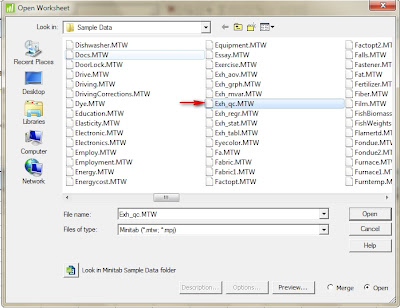
1 Open the worksheet EXH_QC.MTW.
 |
| I-MR chart-1 |
 |
| I-MR chart-2 |
 |
| I-MR chart-3 |
4 Click I-MR Options, then click the Tests tab.
 |
| I-MR chart-4 |
5 Choose Perform all tests for special causes, then click OK in each dialog box.
 |
| I-MR chart-5 |
 |
| I-MR chart-6 |
 |
| I-MR chart |
Interpreting the results
The individuals chart shows 6 points outside the control limits and 22 points inside the control limits exhibiting a nonrandom pattern, suggesting the presence of special causes. The moving range chart shows one point above the control limit. You should closely examine the quarry's processes to improve control over the weight of limestone
shipments.
Reference by www.minitab.com
Category: hothot, How to Minitab


0 ความคิดเห็น