
X-bar and S chart
X-bar and S chart
Variables Control Charts for Subgroups Overview data
 |
| X-bar and S chart |
as length or pressure
, for subgroup data. Variables control charts for individuals,
time-weighted charts, and multivariate charts also plot measurement data.
Attributes control charts plot count data, such as the number of defects or defective units.
For more information about control charts, see Control Charts Overview.
Choosing a variables control chart for subgroups
Minitab offers five variables control charts:
• X-bar and R − an X-bar chart and R chart displayed in one window
• X-bar and S − an X-bar chart and S chart displayed in one window
• I-MR-R/S (Between/Within) − a three-way control chart that uses both
between-subgroup and within-subgroup variation. An I-MR-R/S chart consists of
an I chart, a MR chart, and a R or S chart.
• X-bar − a chart of subgroup means
• R − a chart of subgroup ranges
• S − a chart of subgroup standard deviations
• Zone − a chart of the cumulative scores based on each point's distance
from the center line
The I-MR-R/S (Between/Within) chart requires that you have two or more
observations in at least one subgroup. Subgroups do not need to be the same size.
Minitab calculates summary statistics for each subgroup, which are plotted
on the chart and used to estimate process parameters.
Example of X-bar and S chart
You are conducting a study on the blood glucose levels of 9 patients who are on strict
diets and exercise routines. To monitor the mean and standard deviation of
the blood glucose levels of your patients, create an X-bar and S chart. You take a blood
glucose reading every day for each patient for 20 days.
How to make to X-bar and S chart
1 Open the worksheet BLOODSUGAR.MTW.
 |
| X-bar and S chart 2 |
2 Choose Stat > Control Charts > Variables Charts for Subgroups > Xbar-S.
 |
| X-bar and S chart 3 |
3 Choose All observations for a chart are in one column, then enter Glucoselevel.
 |
| X-bar and S chart 4 |
 |
| X-bar and S chart 5 |
4 In Subgroup sizes, enter 9. Click OK.
 |
| X-bar and S chart 6 |
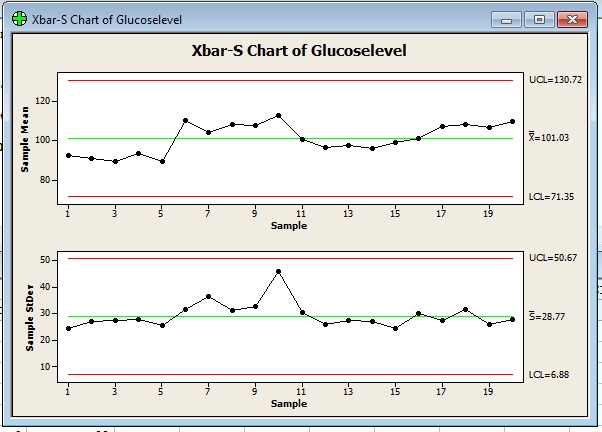
5.we will get to X-bar and S chart below.
|
| X-bar and S chart 7 |
Interpreting the results
The glucose level means and standard deviations over the 10-day period fall
within the control limits. The glucose level and its variability are in control for
the nine patients on the diet and exercise program.
Reference by www.minitab.com
Category: hothot, X-Bar and S chart


0 ความคิดเห็น